
Docker and Docker-Compose concepts are two means in Linux by which a developer can easily generate a running container application from a docker image that is pulled down from a repository at GitHub, LinuxServer.io, or DockerHub, then access that running application in a Web browser at a particular port that is assigned to or configured for the application itself. This assignment is performed within a file called the docker-compose.yml file for docker-compose applications. The docker-compose.yml is short for docker-compose YAML file. YAML is a human-readable data serialization language not unlike XML, the Extensible Markup Language and refers to "Yet Another Markup Language". The YAML file is used for configuration files where data are being stored and transmitted.
Docker Compose YAML files, also known as docker-compose.yml files, are the secret sauce for managing complex applications built with multiple Docker containers. Imagine a web application that relies on a database and a cache service – each requiring its own container. With Docker Compose, you define everything in a single YAML file. This file acts as a blueprint, specifying the services (containers) that make up your application, how they connect, and any additional configurations.
The beauty of YAML files is their readability. They use indentation and keywords to structure information, making it easy for humans to understand what each container does and how they interact. This single file approach streamlines development, testing, and deployment. With a single command, you can build and launch all the necessary containers to get your application running. Docker Compose also simplifies scaling your application – just adjust the configuration and your entire multi-container environment scales up or down accordingly.
Here is an example of a YAML file which I configured for a Docker-Compose application called Speedtest-Tracker, which I'm running on the Raspberry Pi, model 4 SBC in my homelab.
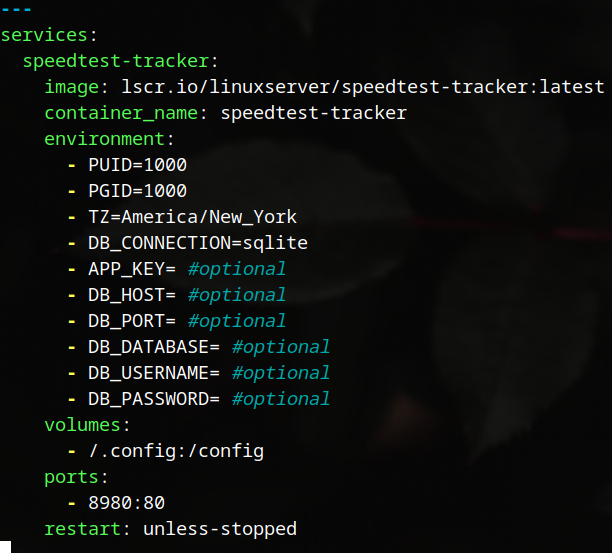
As the image description suggests, this image was taken from LinuxServer.io and is the latest build. Before running this docker-compose.yml file I changed into the speedtest-tracker sub-directory under my docker directory, then ran the command:
$ sudo nano docker-compose.yml
Here, I used the nano text editor. You may use whatever editor you like to use instead. After running this command, I was left with an empty file called docker-compose.yml which exists in the speedtest-tracker sub-directory. After going up on LinuxServer.io I located the image for this application and copied the structure you see here into the empty file and made three changes to the file. The first change was the - TZ=America/New_York line to correspond with my specific Eastern US timezone. The next change was under the Volumes: section where I modified the path on that line to be - /.config:/config which indicates where the data will be stored on my system. And, the final change was made to the internal port assignment, which was originally 80:80 and to which I reconfigured to 8980:80. Thus, this tells docker that the application will be running at the IPv4 address of my Raspberry Pi at port 8980. In my case, this location is: 192.168.1.125:8980. This is the info that I place in my Web browser after the docker application container has been created and launched.
Once the docker-compose.yml file has been reconfigured for my system, I save out the changes to the file and close it. Then, making sure that I'm in the docker/speedtest-tracker subdirectory on my system, I issue the following command in the Linux terminal that tells docker to execute the YAML file and allow the daemon process to run in the background. This makes the application persistent meaning that it will keep running even if I close down the terminal in which it is running. Shutting down the Raspberry Pi or, restarting it, will stop the application. I leave my Raspberry Pi on 24/7.
[1] $ docker-compose.yml up -d
Note here that I did not run this command as sudo. Why is that, you might ask? Well, the answer is simply that I don't like running sudo all the time when using docker since I'm prone to forget to prepend the docker command with sudo most of the time. To make this happen, it is a simple matter of adding my standard user (my username account) to the docker Group, which was created when I installed docker and docker-compose. To add myself to the docker Group, I ran the command:
$ sudo usermod -aG docker datapioneer
This command tells the system in Linux to add datapioneer (that's me) to the docker Group, but as an additional Group assignment rather than a replacement Group assignment, hence the preceding "a" to indicate append. Now, I can run docker commands all day without having to remember to add sudo in front each time.
Docker was created by running the command:
$ sudo apt install docker.io
Docker-compose was created by running the command:
$ sudo apt install docker-compose
When the docker command shown as [1] above is run in Linux, the container creation process begins by docker going out to the repository where the image is stored and grabbing the necessary files and dependencies and pulling them down into the location where the application's YAML file is located. Once completed, the application is executed, and is then available to be accessed via a Web browser.
As I mentioned earlier, I configured my speedtest-tracker application to run on port 8980 at IPv4 address of 192.168.1.125. Here is what the login screen looks like for my application when I have launched it in the Web browser:
Note the address bar in the Brave Web browser shows the IPv4 address and port assignment where the application is currently running on the Raspberry Pi. The default username and password for the application is admin@example.com and password, respectively. You should change this soon after logging in for the first time using the directions provided in the Dashboard.
After logging in, configuring the file, and letting it run for a few days, the graphs that are presented to you are very nicely designed. For example, I've been running my speedtest-tracker app for about 24 hours. Here is the graph for Download/Upload speeds that I see when I get to the Dashboard:
Two additional graphs that are provided show ping and jitter data over the same time frame:
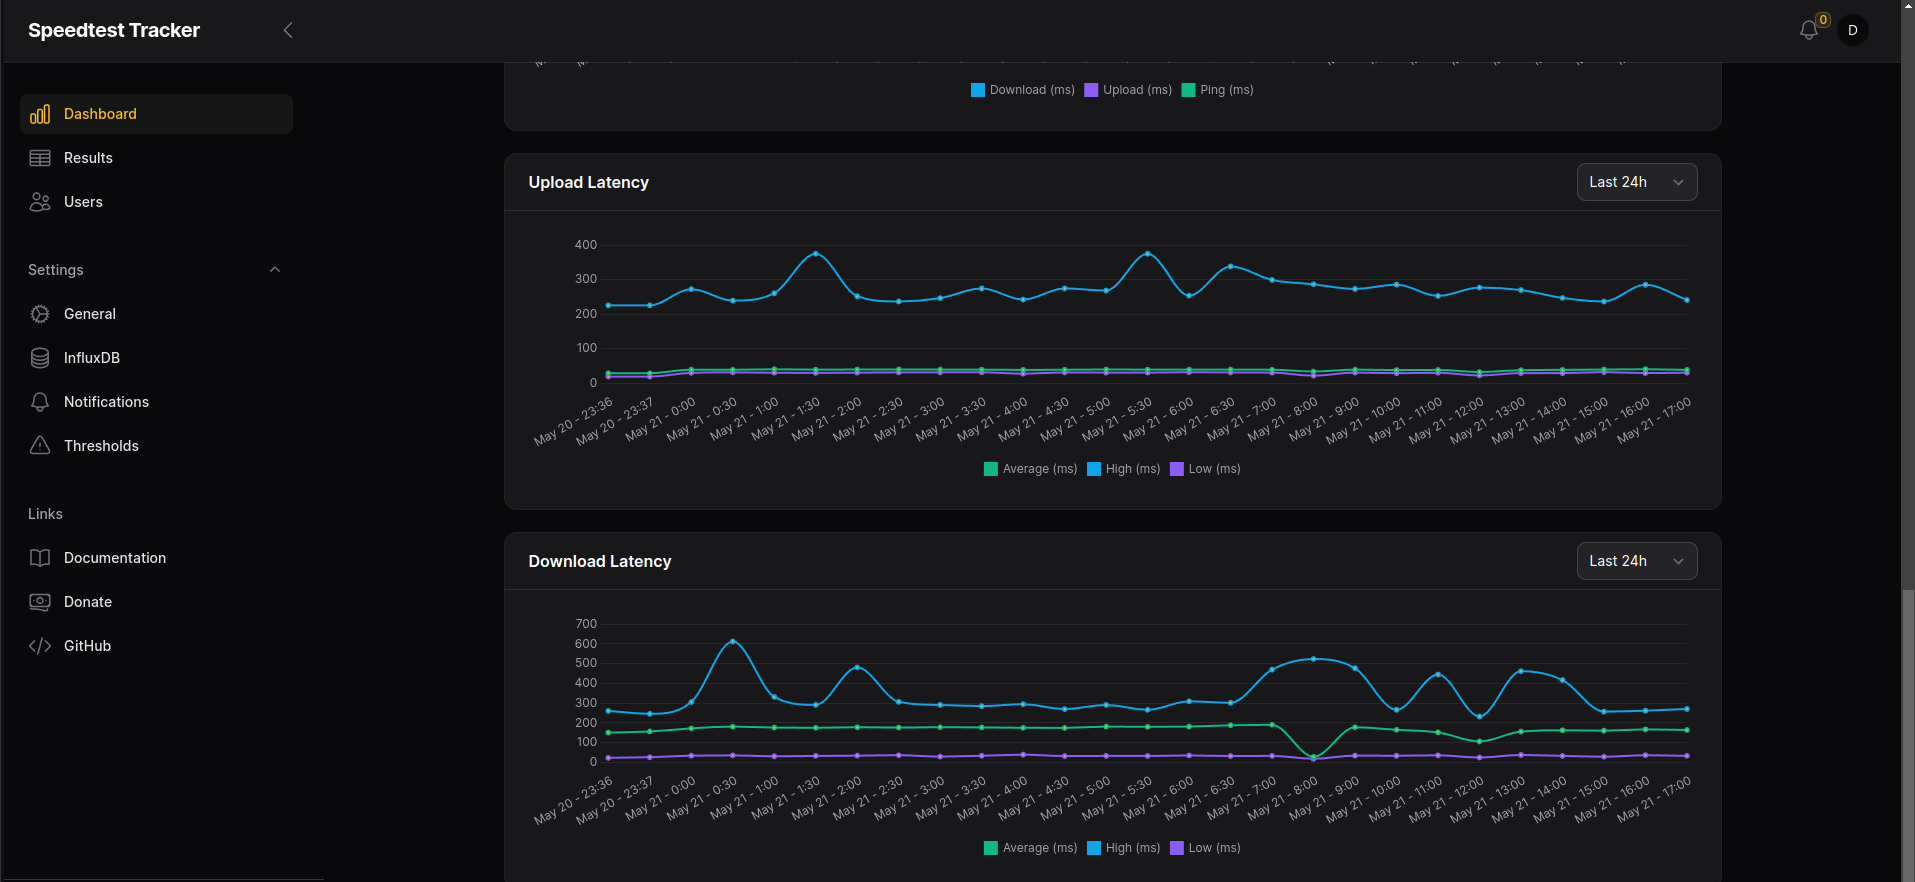
And, finally, Upload and Download Latency data is graphed and presented to you as well.
The speedtests are configured as well wherein I can configure the server(s) that I want the speedtest-tracker app to utilize when conducting scheduled Broadband speedtests using cron. In my particular case, I am using a local Spectrum server in Tennessee and another in Asheville, NC where I live and have configured cron in the Dashboard to run speedtests from either server on an hourly basis.
Having such an application affords me the ability to monitor my Broadband provider, Spectrum Internet, to ensure that I'm getting the CI (committed Internet) rate that I'm paying for. In my case, I'm paying for 300Mbps DOWN / 11.5Mbps UP and, as you can see, I'm getting my money's worth.
This docker-compose application is only one of many that I plan to run simultaneously on my Raspberry Pi, model 4 SBC which has 4GB of RAM and a 128GB MicroSD card installed. Thus, I have ample CPU power and storage capacity for a lot of future data storage capability.
- Log in to post comments